Unmaned Surface Vehicles
Echo Sounders
Side Scan Sonars
Acoustic Doppler Current Profilers
Total Stations
Electronic Theodolites
Digital Levels
Automatic Levels
Handhelds Distance Meters
Prisms/Tripods/Poles/Staffs...
Mapping Drones & Payloads
UAV Applications
Terrestrial Laser Scanners
LiDARs
SLAM LiDAR
Satellite Imagery
Automatic Deformation Monitoring Systems
Environmental Monitoring Systems
Relevant Sensors
VR Simulated Surveying Training Systems
Auto Steering
Track Geometry Measuring Trolley Systems
Automated Tunnel Scanning & Inspection Systems
Model:
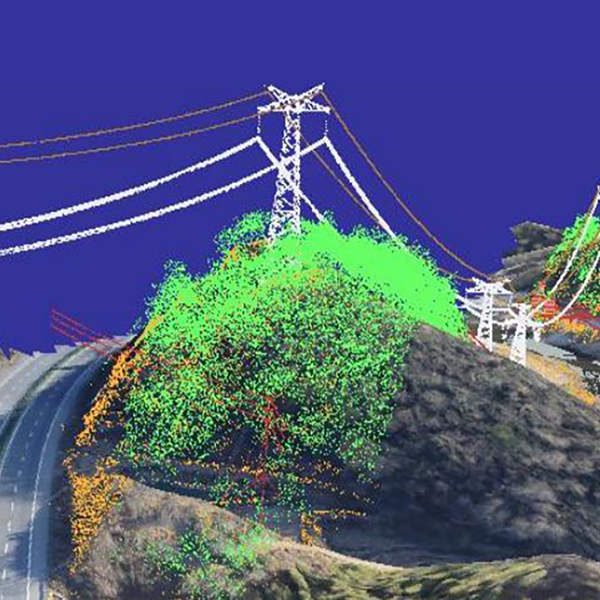
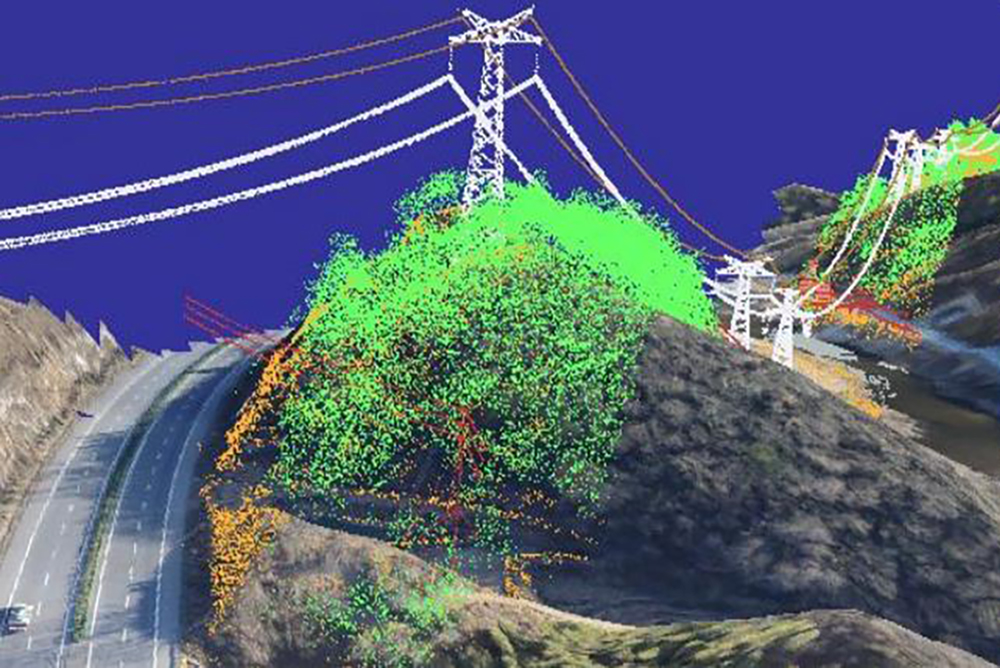
Compared with the conventional methodology, power line management utilizing mobile laser scanning enjoys higher efficiency, more deliverables and more complete spatial database, which has been exploded in the recent decades and become a new technology for this specialized application. The laser point cloud may help to reconstruct the power line facilities in 3 dimension and restore the 3D fundamental geo-spatial data of power line corridors, ground objects (eg. trees, buildings, etc.), routes, electric towers, electric poles and modules. Furthermore, the zillions of points captured from remote sensing technology may also help to the digitized and visualized management of corridor facilities and power grid facilities like power stations, substations, etc.
The job details include
● fine planning of routing development
● power line corridor as-built survey
● comprehensive analysis of corridor linear tree
Case Study:
Step 1, conduct aerial laser scanning of the job area
Step 2, process the aerial trajectory information and generate the geo-referenced point cloud
Step 3, further deal with the point cloud and delete the noise points
Step 4, classify the point cloud and extract the ground points and vegetation points (if necessary, extract the individual tree metrics and analyze the tree growth conditions and index for evaluating the future clearances)
Step 5, vectorize the power lines, electric towers and electric poles
Step 6, analyze tower/pole inclination, crossarm vertical difference, power line sag, the distance between power lines and towers, clearance distance, hazardous locations based on the data of power lines, electric towers, electric poles and vegetations
Step 7, verify the accuracy and precision on the site
Step 8, submit the reports
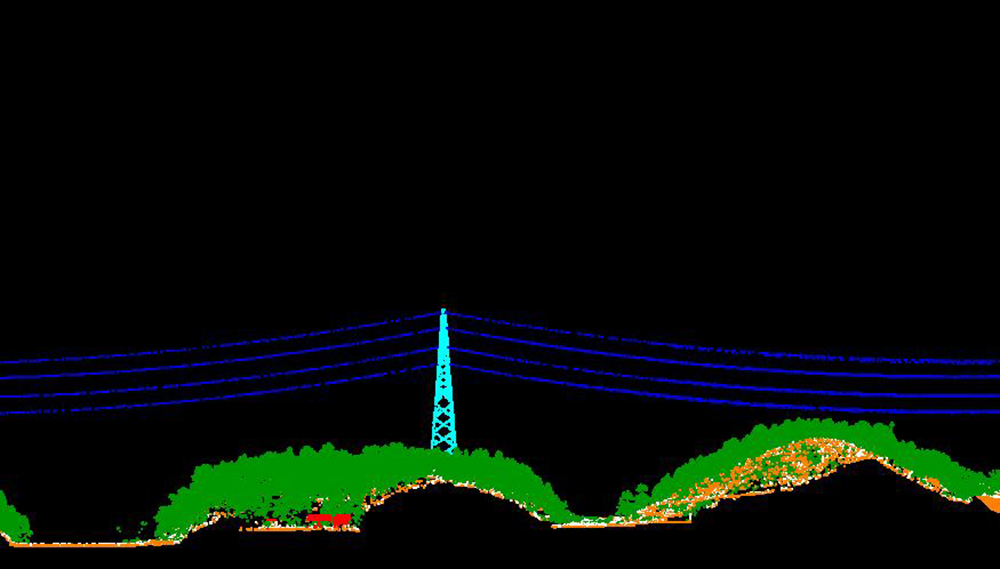
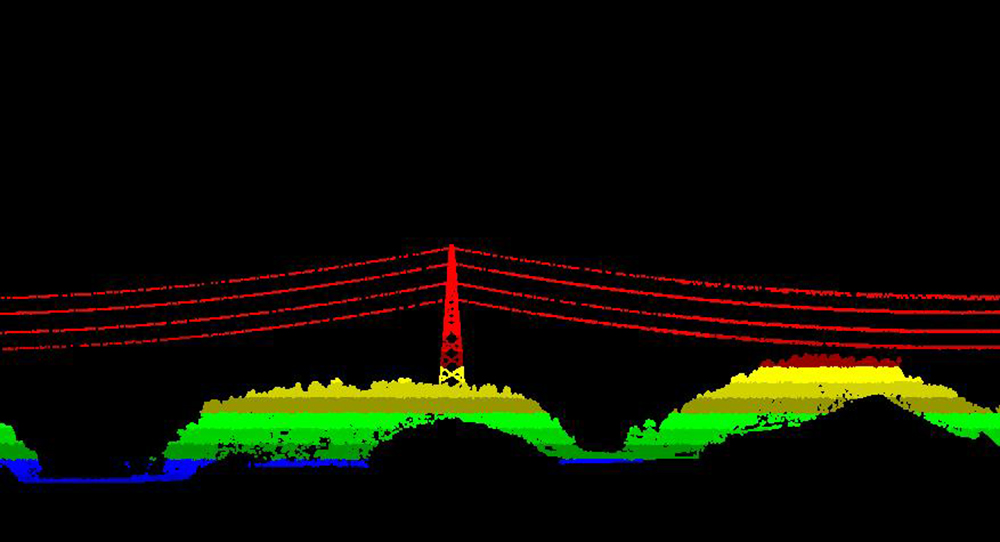
Refer to the outputs below:
classified point cloud including vegetation points and ground points
point cloud displayed in elevation mode
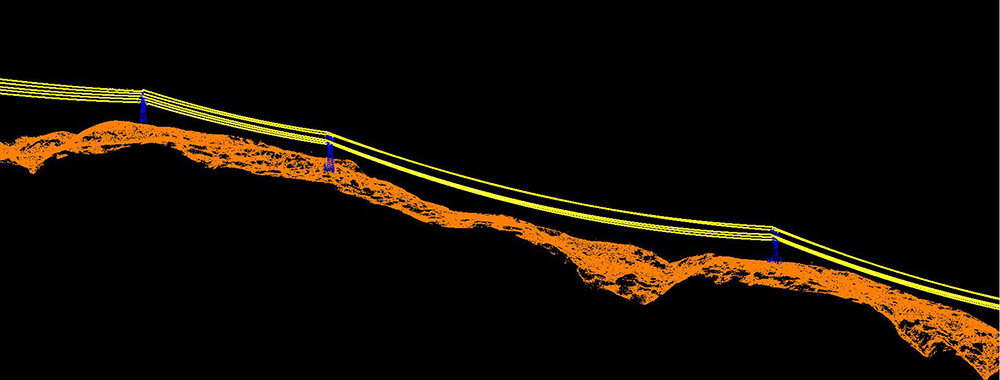
separated point cloud of power lines and bare ground