Forestry Investigation

    Model:

    Applications

    Forestry resources investigation is to give an index to the forestry management conditions of a certain area by studying the species, distribution, quantity and quality of different resources such as forest, woods and timberlands. The routine includes,


    ● to study the species, quantity, quality and distribution of forest, woods and timberlands

    ● to study the changes of coverage, protection and use, properties, etc. 

    ● to analyze and evaluate the biological conditions and management results of forestry resources

    ● to provide advices of resources development, protection and use


    The conventional methodology relies on ground investigation and remote sensing image estimation, which precision is usually unsatisfactory. Therefore, mobile laser scanning has become another highly efficient remote sensing technology of studying the forestry index. 


    With the laser point cloud, users may extract individual tree metrics like location, tree height, diameter of breast height, crown diameter, stock volume, void rate, etc. Furthermore, multiple data captures may also help with the statistics of canopy height variable, tree density variable, tree intensity variable, leaf area index, void rate, etc. 


    Case Study:

    Job area: 10 hectares

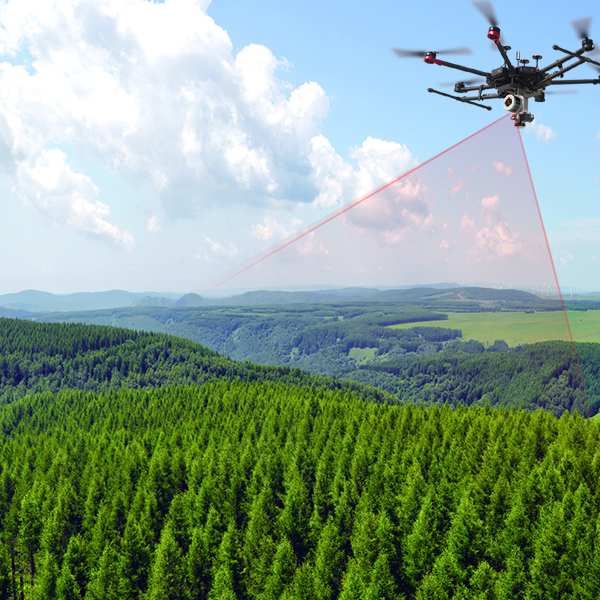
    Equipment: DJI M600 Pro + LiDAR SZT-R250

    Fieldwork: 2 persons

    Processing: 1 person

    Step 1, conduct aerial laser scanning of the job area

    Step 2, process the aerial trajectory information and generate the geo-referenced point cloud

    Step 3, further deal with the laser point cloud and delete the noise points

    Step 4, extract the ground points and obtain DSM (Digital Surface Model), DEM (Digital Elevation Model) and CHM (Canopy Height Model)

    Step 5, generate seed points from CHM and extract individual tree metrics

    Step 6, export the CSV file consisting of the measurements such as ID, x, y, z, height, canopy diameter and canopy area as well as the SHP file of tree profiles.  


    Refer to the outputs below:


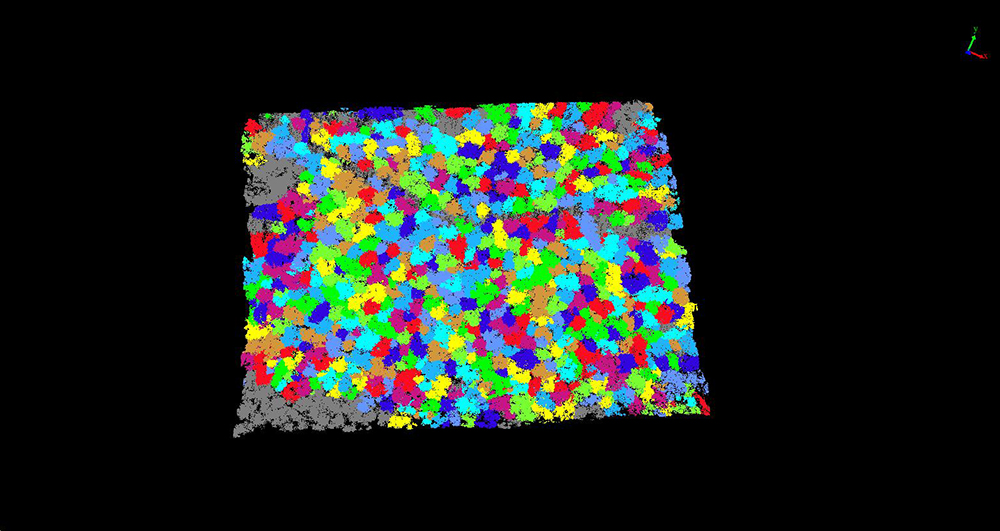
    04141

    View the point cloud in Group, and different color lumps of represent different tree individuals. 


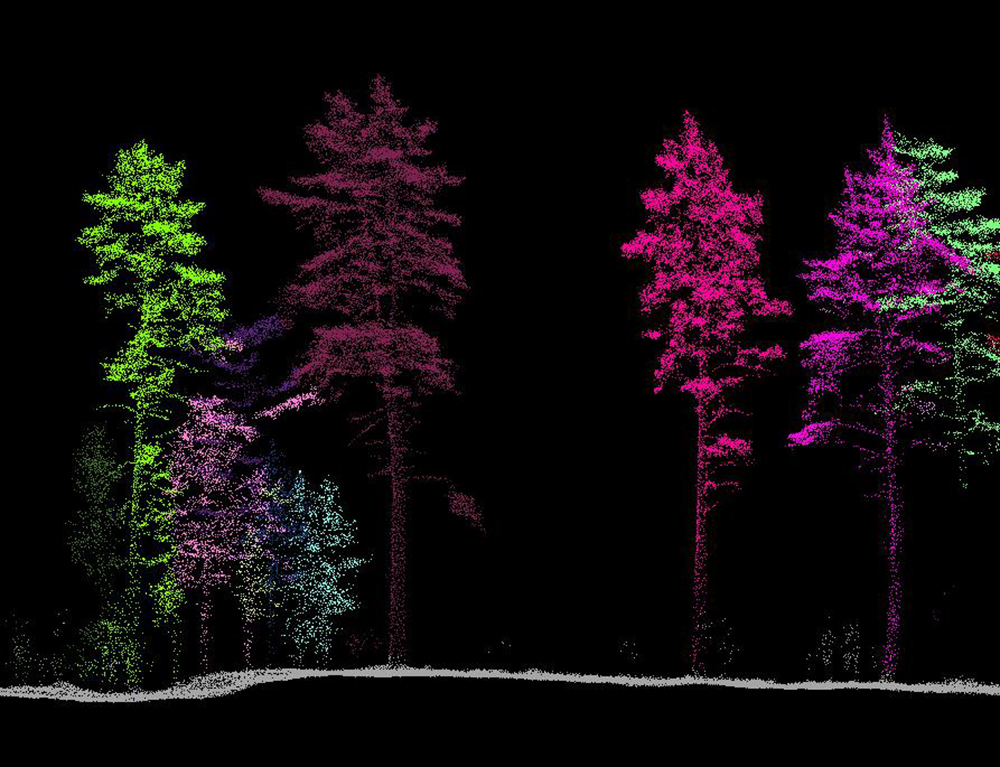
    04142

    after extracting individual tree metrics, trees will be displayed into different colors


    04143

    export a CSV sheet that contains the tree attributes above 


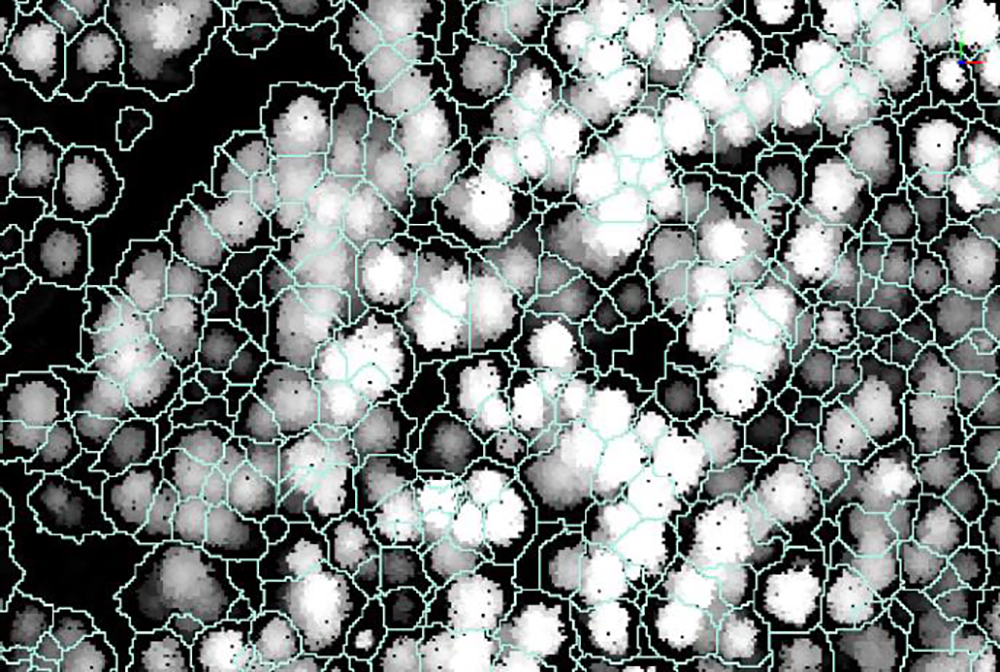
    04144

    export the SHP file of showing the tree profiles